View the entries

The Matilda Centre for Research in Mental Health and Substance Use undertakes world-leading research into the prevention and care of mental health and substance use issues. This Matilda Viz competition asked students at the University of Sydney to source data related to mental health and/or substance use and create a visual representation of the data to tell a story or highlight an important issue. We received some fantastic entries, and we are excited to announce the four winning submissions (each receiving a $300 prize).

Angela Pan, student
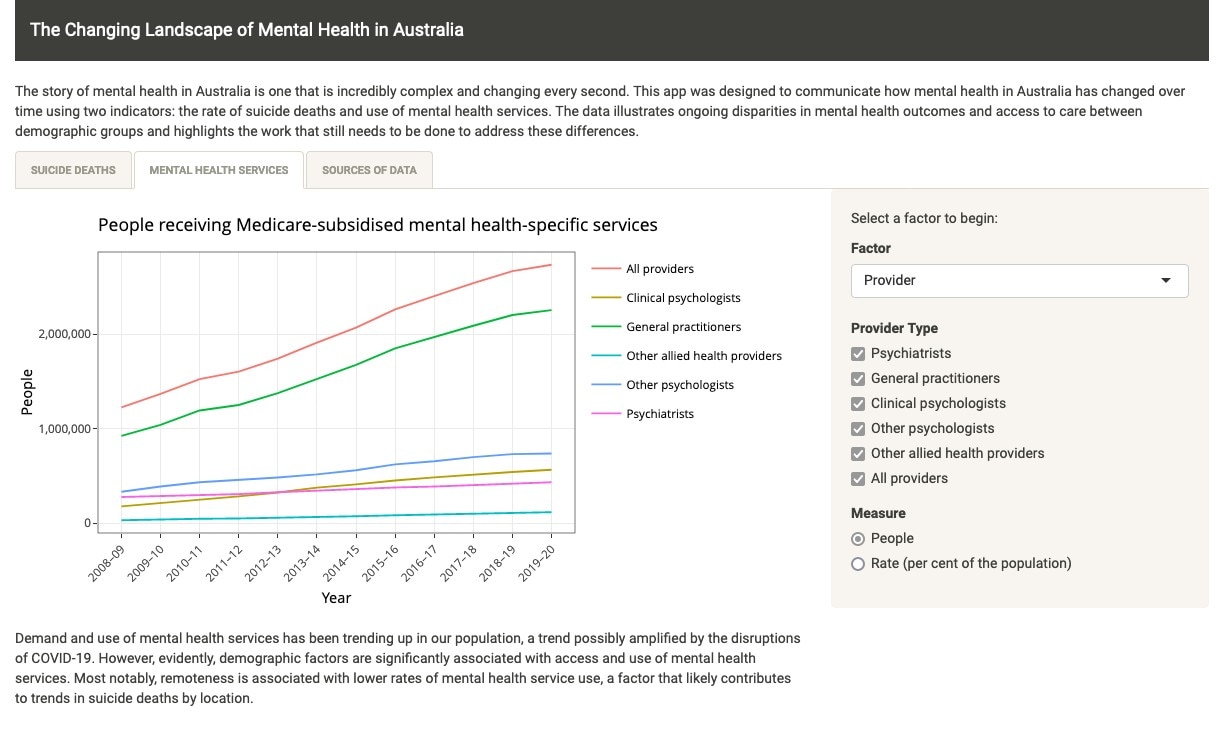
"The story of mental health in Australia is incredibly complex and changing every second. This app was designed to communicate how mental health in Australia has changed over time. The app explores two indicators of Australia's mental health - rates of suicide deaths and the use of mental health services.
The visualisation was produced in RStudio and deployed as a Shiny App based on time series data compiled from various data sets provided by the Australian Institute of Health & Welfare. The data demonstrate that whilst suicide rates have fluctuated significantly over time, there was no evidence to suggest rates of suicide increased in 2020 relative to previous years following the COVID-19 pandemic. However, at the same time, there is an ever-increasing demand for mental health services across the board, which has potentially been accelerated by the ongoing impacts of COVID-19.
This interactive visualisation allows providing insight into the disparities that exist between demographic groups. Mental health care for males, Indigenous people and people located in remote Australia must be prioritised. I hope this visualisation provides valuable insight into the changing landscape of mental health in Australia and highlights the work that still needs to be done in this area."

Antonius Nugraha Widhi Pratama, student
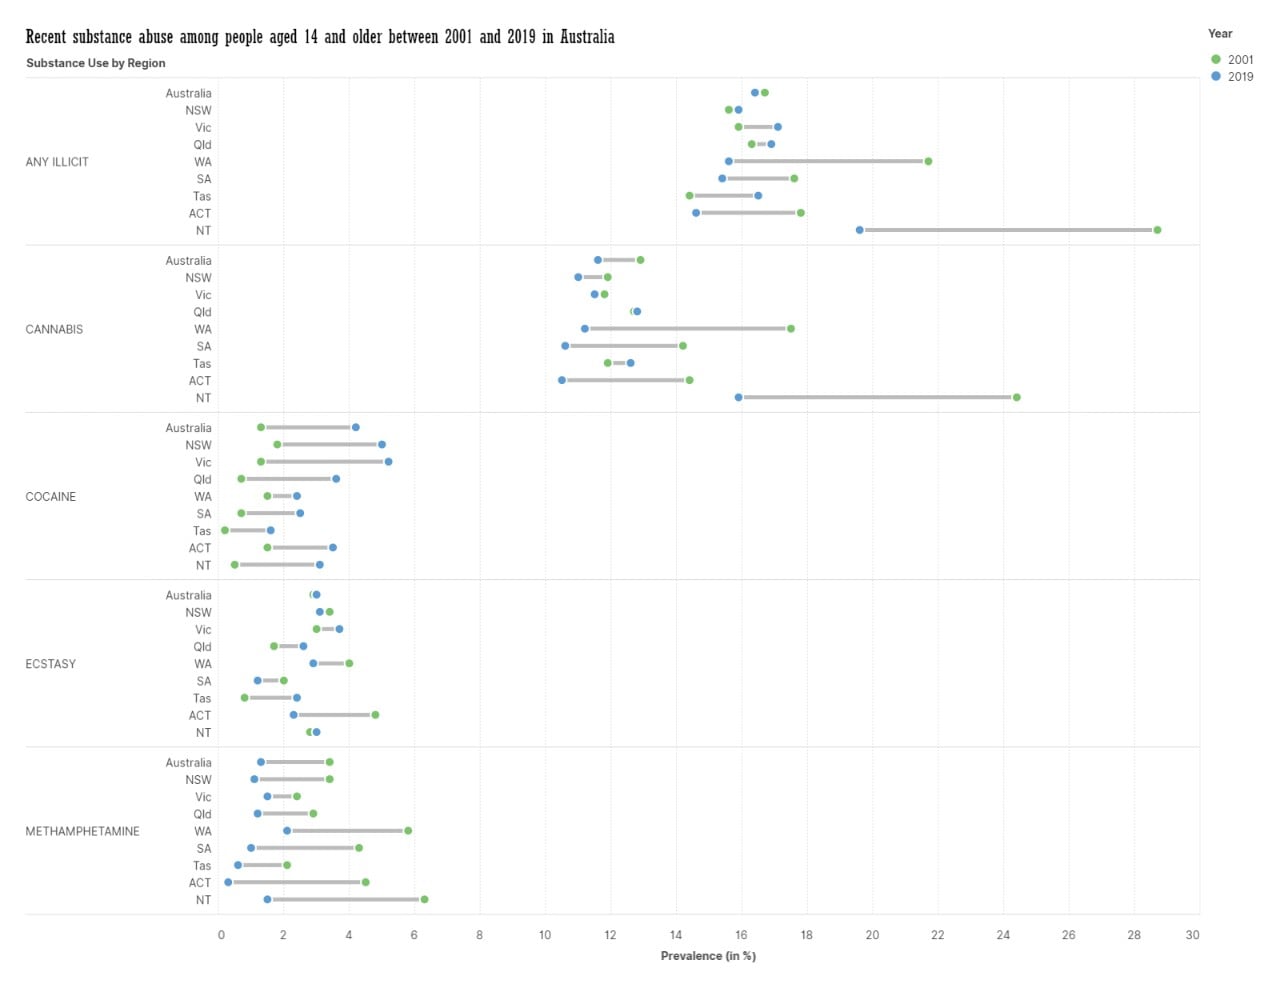
"These graphs visualise the comparative figures of illicit drug use, including ecstasy, cannabis, cocaine, non-medical methamphetamine (and amphetamine) and others among people aged 14 and older between 2001 (green dot) and 2019 (blue dot) in whole Australia and each of its states and territories. The prevalence is expressed in percentage. The aggregate data were taken from AIHW downloadable file.
Across five categories of abused substances, cocaine use is the most alarming one as its increasing prevalence occurred in all regions in 2019, marked by the widening position of blue dots from green dots. Although the prevalence numbers remained below 6%, the trend must be taken into attention. In contrast, the non-medical methamphetamine (and amphetamine) and cannabis uses decreased significantly in 2019 compared to 2001. While the downtrend of non-medical methamphetamine (and amphetamine) use occurred in all states and territories, the upward trend of cannabis use remained to be seen in Queensland and Tasmania."

Iliana Zhen Zhu Young, student
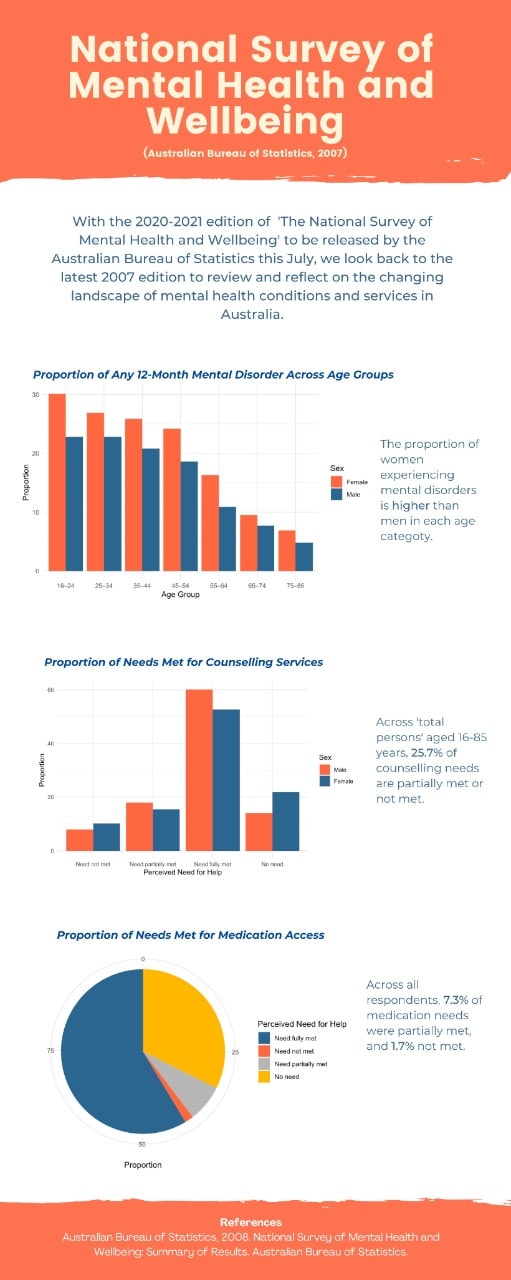
"With the upcoming 2020-2021 edition of 'The National Survey of Mental Health and Wellbeing' to be released by the Australian Bureau of Statistics within the next month, the current infographic reviews the mental health conditions and services of the latest available 2007 edition.
The current infographic prioritises the three main areas of:
It is the aim of the infographic to communicate these figures such that trends across sex, age and 'perceived need for help' can be understood in a clear manner. Ultimately, the infographic encourages viewers to contemplate the challenges of the mental health system within the Australian population."

Ash King, student
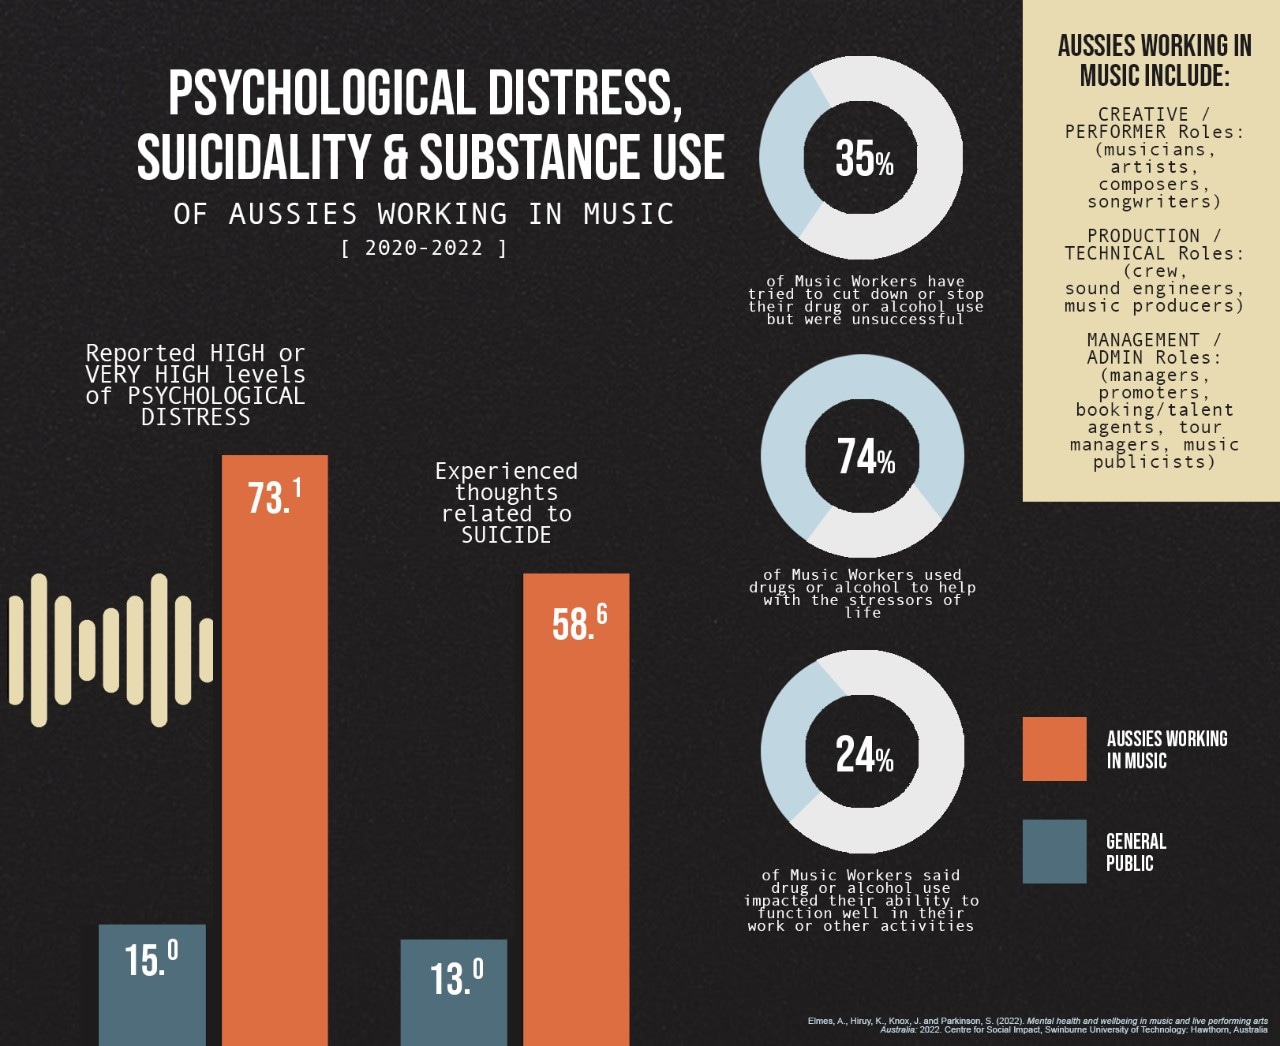
"The last few years have been tough for those working in the music industry. For an industry known for its emotional turbulence and financial precarity, a global pandemic was all that was needed to expose the music industry as one in which workers experience an inordinately high degree of mental health issues.
This data visualisation depicts the findings regarding psychological distress, suicidal thinking, and substance use amongst those who work in the Australian music industry according to an industry-wide study conducted in April/May of this year, and comprising of 1568 participants."
Congratulations to all entrants and prize winners!
We look forward to running this competition again in 2023. Join the Matilda Viz mailing list for updates about next year’s competition.